Detailed 10 Day Precipitation and Temperature Forecast for key Corn (Maize) producing areas
The above tables show the average 10 day accumulated precipitation forecast, in millimeters (mm), and the min/max temperature forecast, in degrees Celsius, for a selection of locations in key maize (corn) producing areas in the indicated country or region.
The locations are sorted showing those with the most forecast precipitation at the top of the table, with the average mm (for all locations), highest max temperature and lowest min temperature (across all locations), shown at the very top of each table. Precipitation forecasts below 25 mm are shown in red. Maximum temperatures equal to and above 36 degrees Celsius are shown in bold red with a yellow background. Minimum temperatures below 5 degrees Celsius are shown in red.
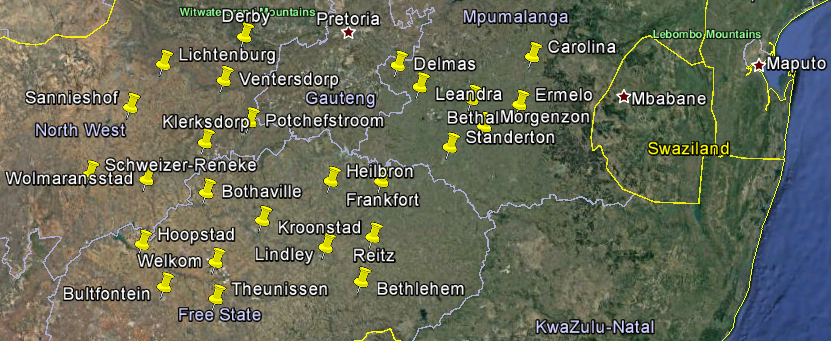
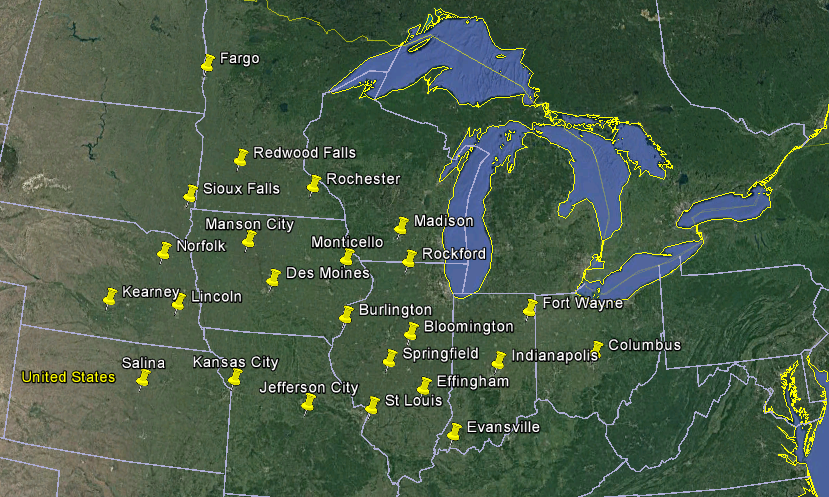
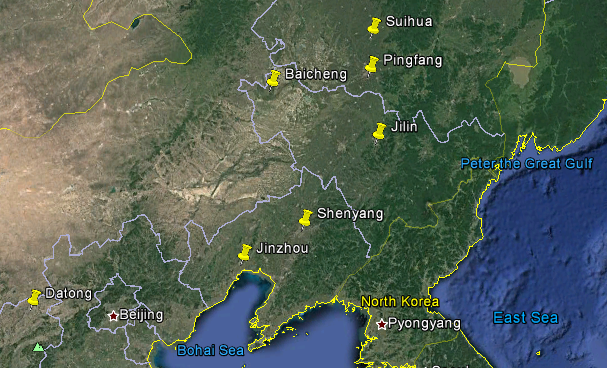
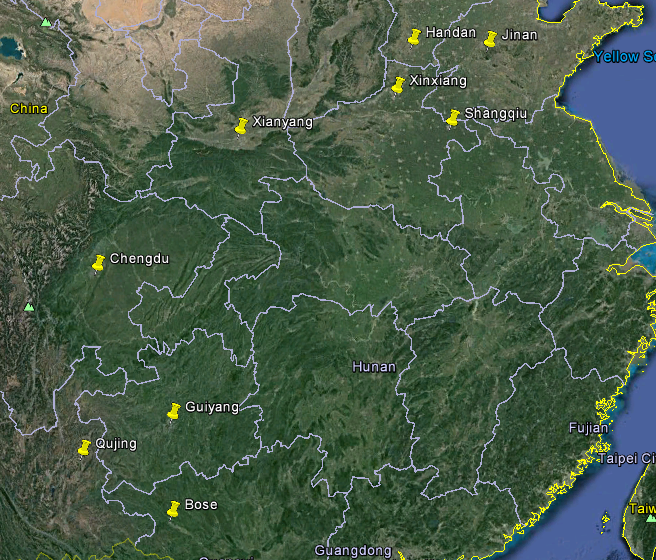
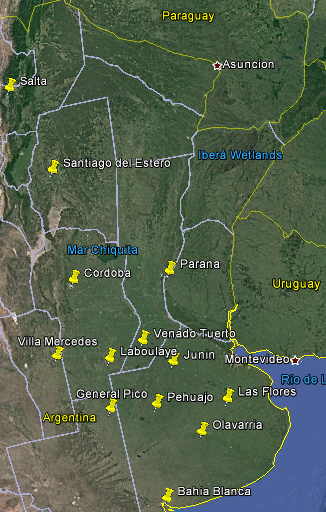
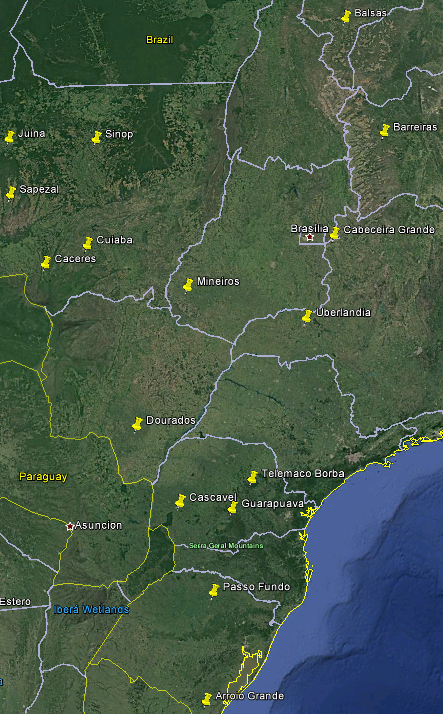
The locations used in the forecasts are depicted below courtesy of Google Earth.
United States Corn Locations
China Northern Corn Locations
China Southern Corn Locations
Argentina Corn Locations
Brazil Corn Locations
South Africa Corn Locations
